The 2020 - 2024 Coronavirus Pandemic in the UK
Return to the Home Page
The course of the coronavirus pandemic in the UK over four years from March 2020 until March 2024 is shown below in a single chart summarising key metrics downloaded from the UK coronavirus Dashboard, this was updated weekly on Thursdays until 14th December 2023. Subsequent data was downloaded from the UKHSA data dashboard. The data may also be visualised as an animation.
In the chart weekly values have been scaled by Z-score normalisation (whereby the mean of each data series, Mean[D], is subtracted from each value in that series, d, the result being divided by the standard deviation of the series StdDev[D]). As can be seen most values fall within two standard deviations of the mean. The chart and discussion were updated regularly until the end of March 2024.
The Current Situation
Extremely infectious Omicron sub-variants now cause most cases in the UK. The ratio of deaths to hospital admissions is now relatively steady but the NHS remains under severe pressure. Infections, hospital admissions and deaths rose in October 2022, but after falling in November rose again in December and then remained fairly steady for a while. The number of infections and hospital admissions have increased since mid-July 2023. After that the percentage of positive tests reached record levels because the number of tests taken remained low despite an increase in infections. This metric was discontinued after Jul;y 2023.
Note that the graph, which represented the situation for the entire UK until 20th May 2022, now represents the data for England only because of changes in the way that the underlying data is reported. This is not expected to have affected the standardised data significantly.
Z-Score Standardised UK Weekly Data reported for the weeks ending 5th March 2020 to 30th March 2024
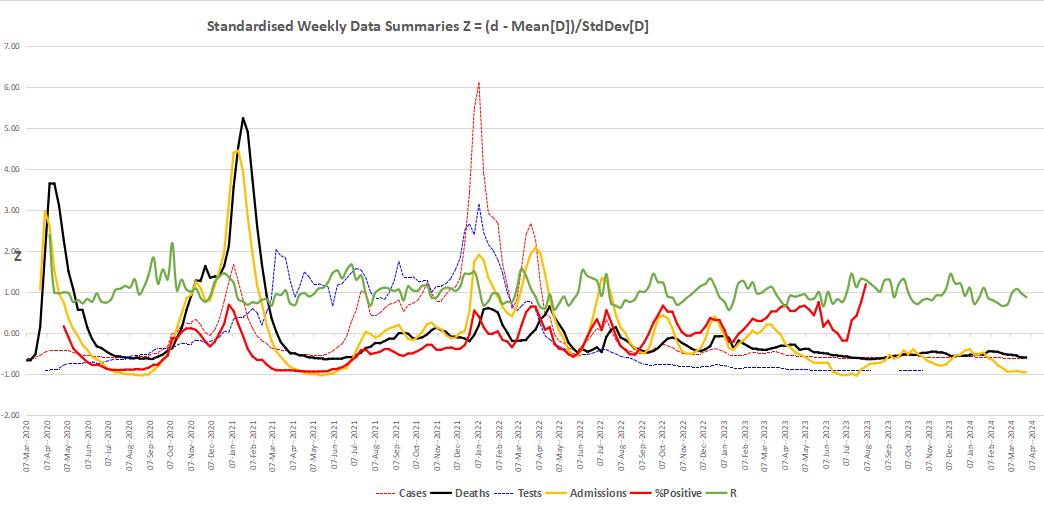
Data Series Chart Symbols Weekly data series description Weekly Minimum Weekly Maximum Latest Reported Virus Tests Conducted [dotted blue line] Number of PCR and Lateral Flow tests processed. 25,884 [ 7 Oct 23 ] 11,846,595 [ 8 Jan 22 ] Discontinued Confirmed Cases [dotted red line] Number of positive tests reported. 183 [ 07 Mar 20 ] 1,227,288 [ 8 Jan 22 ] 1,127 % of Positive Tests [solid red line] Percentage of the tests reported as positive. 0.2% [ 1 May 21 ] 19.6 [ 12 Aug 23 ] Discontinued Hospital Admissions [solid yellow line] Number of patients admitted to hospital 677 [ 22 Aug 20 ] 28,761 [ 16 Jan 21 ] 1,164 Deaths [solid black line] Number of deaths within 28 days of a positive test 2 [ 07 Mar 20 ] 8,739 [ 23 Jan 21 ] 109 R [see note] [smoothed green line] The ratio of the percentage of positive tests adjusted for the number of tests per week in successive weeks. Notes: - Data to May 2022 is for the entire UK. From 20th May 2022 the data is for England only.
- The reproduction number R, which is an approximation, has not been standardised.
Testing and the number of confirmed cases The number of people testing positive each week [dotted red line] surged in September and October 2020 and again very rapidly in December 2020 and 2021. However, this does not take into account the number of PCR and Lateral Flow tests recorded [dotted blue line], which increased from around 110,000 per week in early April 2020 to over ten million per week by December 2021. The percentage of positive tests [solid red line], shown from May 2020 onwards, was until early 2023 a better metric, assuming that those tested were a consistently representative sample of the overall population. The steady increase in this metric between January and May 2023 while the actual number of infections reported was falling consistently suggested a decline in concern amongst the general population leading to a progressive decrease in the number of 'precautionary' Covid tests being reported. Now that free coronavirus test kits are no longer avilable the number of tests taken weekly has remained at a low level and the percentage of positive tests increased to record levels as the number of infections crept up. Note that this metric [the solid red line on the graph] is no longer updated and R becomes the simple ratio of the number of cases for the last two weeks reported.
Hospital admissions and deaths
During the first wave of coronavirus infections the weekly percentage of positive tests and the number of hospital admissions peaked in mid-April 2020, followed by a peak in deaths a couple of weeks later. A similar but less alarming trend which developed in October 2020 was somewhat mitigated by the four-week lockdown ending on 2nd December 2020. Then the number of infections, hospital admissions and Covid-related deaths soared and it was clear that the more infectious variants of Covid were getting out of control. The effects of the January 2021 lockdown and the successful vaccination program are apparent, the proportion of positive cases and the numbers of hospital admissions and deaths falling consistently during February, March and April 2021, rising again when the highly infective Omicron variant arrived in the UK in December 2021.
Reproduction number R
For the purposes of this summary the reproduction number, R, the average number of secondary infections produced by a single infected person, [plotted as a smoothed solid green line on the chart] has been estimated as the ratio of the percentage of positive tests adjusted for the overall number of tests in successive weeks. This value may 'bounce around', with the ratio changing noticeably from week to week, particularly when the number of cases is low, the trend over a month or so being more meaningful. The first lockdown in March 2020 resulted in a decrease in R, followed by a slow increase during the summer when infections were low. In September 2020 the general trend was a more rapid rise, followed by a slow decline during the November 2020 lockdown and a more rapid rise in the run up to Christmas. After falling in January and February 2021 R rose remorselessly until January 2022. After 17th August 2023 this is the simple ratio of the number of infections reported in the last two weeks.
Overall number of infections
The Imperial College REACT immunoassay study of 109,000 randomly selected participants in England conducted between 20th June and 13th July 2020 estimated that around 3.3 million people, approximately 6% of the population of England, had antibodies to SARS-CoV-2 by the end of June 2020, the overall infection fatality ratio being 0.90%. The proportion of the population who have contracted the virus is now significantly higher, probably by a factor of four or more. Modelling reported in The Guardian [11th January 2021] suggested that over 12 million people in England had been infected by that date. A further 11 million positive tests have been reported since then. The Office for National Statistics [ONS] estimated that 1 in 13 residents of England were infected with the virus between 20th and 26th March 2022, the highest proportion of infections since the start of the pandemic.
|
© Chris Newall 2024 Author : Chris Newall Page created on : 12th October 2020 Last updated on : 28th June 2024 |